
Sometimes we need to create charts for displaying any progress or report in our Ionic 3 mobile apps. Right now, we have to show you a simple step by step tutorial on creating beautiful charts (line, doughnut, and bar) easily using Ionic 3 and Angular 4. This tutorial using existing Angular 2 directive module that can use very well with Angular 4. This directive makes the use of Charts.js more simple and easy to integrated with Angular 4 app, in this case for Ionic 3 mobile apps.
Table of contents:
- Create Ionic 3 and Angular 4 Apps
- Install Angular 2 Charts and Charts.js
- Show Line Charts
- Create Bar Charts
- Create a Doughnut Chart
In this tutorial we just need a few tools and modules:
Let's started the tutorial.
Create Ionic 3 and Angular 4 Apps
We are creating Ionic 3 and Angular 4 mobile apps using tabs template. Open the terminal or Node command line then type this command.
ionic start ionic-charts tabsAfter waiting for NPM modules installed, go to the newly created app folder.
cd ionic-chartsTo check the version of Ionic CLI and required tools type this command.
ionic infoYou will see the latest Ionic CLI versions similar to this (I'm using OS X).
cli packages: (/Users/didin/Documents/Apps/ionic-charts/node_modules)

    @ionic/cli-plugin-ionic-angular : 1.4.1
    @ionic/cli-utils                : 1.7.0
    ionic (Ionic CLI)               : 3.7.0

local packages:

    @ionic/app-scripts : 2.1.3
    Ionic Framework    : ionic-angular 3.6.0

System:

    Android SDK Tools : 26.0.2
    Node              : v6.9.4
    OS                : OS X El Capitan
    Xcode             : Xcode 8.0 Build version 8A218a
    ios-deploy        : 1.9.0
    ios-sim           : 5.0.12
    npm               : 3.10.10
As usual, to make sure Ionic 3 app working, run this app first.
ionic serve --labIt will automatically open a default browser with this page.
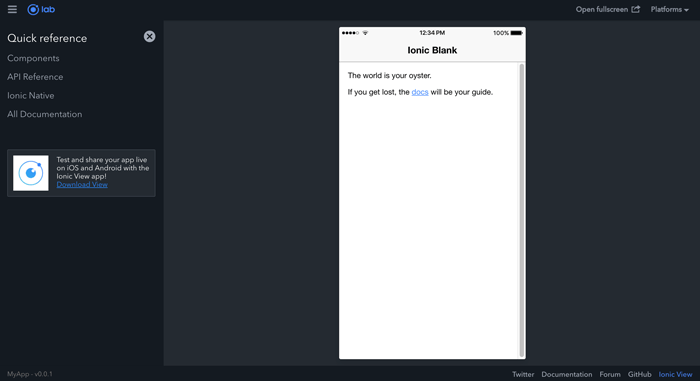
Install Angular 2 Charts and Charts.js
To install Angular 2 charts (ng2-charts) and Charts.js, simply type this command.
npm install ng2-charts --save
npm install chart.js --save
Open and edit 'src/app/app.module.ts' then add this import of ChartsModule.
import { ChartsModule } from 'ng2-charts';Then declare the charts module in imports array.
imports: [
  BrowserModule,
  IonicModule.forRoot(MyApp),
  ChartsModule
],
That's the only things need to install.
Show Line Charts
To show line charts add the default Ionic HTML tags that taken from Angular 2 charts example. We will display the line chart in the canvas with some attributes that available from Angular 2 Charts. Open and edit 'src/pages/home/home.html' then add these lines inside 'ion-content'.
<ion-content padding>
  <div class="row">
    <div class="col-md-6">
      <div style="display: block;">
      <canvas baseChart width="300" height="400"
                  [datasets]="lineChartData"
                  [labels]="lineChartLabels"
                  [options]="lineChartOptions"
                  [colors]="lineChartColors"
                  [legend]="lineChartLegend"
                  [chartType]="lineChartType"
                  (chartHover)="chartHovered($event)"
                  (chartClick)="chartClicked($event)"></canvas>
      </div>
    </div>
  </div>
</ion-content>
Now, open and edit 'src/pages/home/home.ts' then add these variables that required to build line charts before the constructor.
public lineChartData:Array<any> = [
  {data: [65, 59, 80, 81, 56, 55, 40], label: 'Series A'},
  {data: [28, 48, 40, 19, 86, 27, 90], label: 'Series B'},
  {data: [18, 48, 77, 9, 100, 27, 40], label: 'Series C'}
];
public lineChartLabels:Array<any> = ['January', 'February', 'March', 'April', 'May', 'June', 'July'];
public lineChartOptions:any = {
  responsive: true
};
public lineChartColors:Array<any> = [
  { // grey
    backgroundColor: 'rgba(148,159,177,0.2)',
    borderColor: 'rgba(148,159,177,1)',
    pointBackgroundColor: 'rgba(148,159,177,1)',
    pointBorderColor: '#fff',
    pointHoverBackgroundColor: '#fff',
    pointHoverBorderColor: 'rgba(148,159,177,0.8)'
  },
  { // dark grey
    backgroundColor: 'rgba(77,83,96,0.2)',
    borderColor: 'rgba(77,83,96,1)',
    pointBackgroundColor: 'rgba(77,83,96,1)',
    pointBorderColor: '#fff',
    pointHoverBackgroundColor: '#fff',
    pointHoverBorderColor: 'rgba(77,83,96,1)'
  },
  { // grey
    backgroundColor: 'rgba(148,159,177,0.2)',
    borderColor: 'rgba(148,159,177,1)',
    pointBackgroundColor: 'rgba(148,159,177,1)',
    pointBorderColor: '#fff',
    pointHoverBackgroundColor: '#fff',
    pointHoverBorderColor: 'rgba(148,159,177,0.8)'
  }
];
public lineChartLegend:boolean = true;
public lineChartType:string = 'line';

public randomize():void {
  let _lineChartData:Array<any> = new Array(this.lineChartData.length);
  for (let i = 0; i < this.lineChartData.length; i++) {
    _lineChartData[i] = {data: new Array(this.lineChartData[i].data.length), label: this.lineChartData[i].label};
    for (let j = 0; j < this.lineChartData[i].data.length; j++) {
      _lineChartData[i].data[j] = Math.floor((Math.random() * 100) + 1);
    }
  }
  this.lineChartData = _lineChartData;
}

// events
public chartClicked(e:any):void {
  console.log(e);
}

public chartHovered(e:any):void {
  console.log(e);
}
As you see there's an array of data that build line charts, lineChartLabel, lineChartOption, lineChartLegend, lineChartColors, lineChartType, and the function that handle chart events. Now, run again the app. You should see the line charts inside the home tab.

Create Bar Charts
To create bar charts, we just use existing about tab. The Bar Charts will display in canvas that has the attribute of Angular Charts. Open and edit 'src/pages/about/about.html' then replace the content of 'ion-content' with these codes.
<ion-content padding>
  <div>
    <div style="display: block">
      <canvas baseChart
              [datasets]="barChartData"
              [labels]="barChartLabels"
              [options]="barChartOptions"
              [legend]="barChartLegend"
              [chartType]="barChartType"
              (chartHover)="chartHovered($event)"
              (chartClick)="chartClicked($event)"></canvas>
    </div>
    <button (click)="randomize()">Update</button>
  </div>
</ion-content>
Next, open and edit 'src/pages/about/about.ts' then add these variables before the constructor.
public barChartOptions:any = {
scaleShowVerticalLines: false,
responsive: true
};
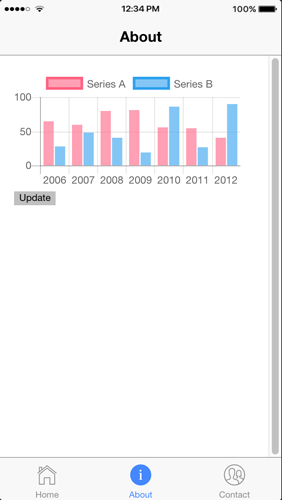
public barChartLabels:string[] = ['2006', '2007', '2008', '2009', '2010', '2011', '2012'];
public barChartType:string = 'bar';
public barChartLegend:boolean = true;
public barChartData:any[] = [
{data: [65, 59, 80, 81, 56, 55, 40], label: 'Series A'},
{data: [28, 48, 40, 19, 86, 27, 90], label: 'Series B'}
];
// events
public chartClicked(e:any):void {
console.log(e);
}
public chartHovered(e:any):void {
console.log(e);
}
public randomize():void {
// Only Change 3 values
let data = [
Math.round(Math.random() * 100),
59,
80,
(Math.random() * 100),
56,
(Math.random() * 100),
40];
let clone = JSON.parse(JSON.stringify(this.barChartData));
clone[0].data = data;
this.barChartData = clone;
/**
* (My guess), for Angular to recognize the change in the dataset
* it has to change the dataset variable directly,
* so one way around it, is to clone the data, change it and then
* assign it;
*/
}Take a look again at the running app on the browser. On the about tab will look like this.
Create a Doughnut Chart
To create doughnut charts, we just use existing about tab. Open and edit 'src/pages/contact/contact.html' then replace the content of 'ion-content' with these codes.
<ion-header>
  <ion-navbar>
    <ion-title>
      Contact
    </ion-title>
  </ion-navbar>
</ion-header>

<ion-content>
  <div style="display: block">
    <canvas baseChart
                [data]="doughnutChartData"
                [labels]="doughnutChartLabels"
                [chartType]="doughnutChartType"
                (chartHover)="chartHovered($event)"
                (chartClick)="chartClicked($event)"></canvas>
  </div>
</ion-content>
Next, open and edit 'src/pages/contact/contact.ts' then add these variables before the constructor.
// Doughnut
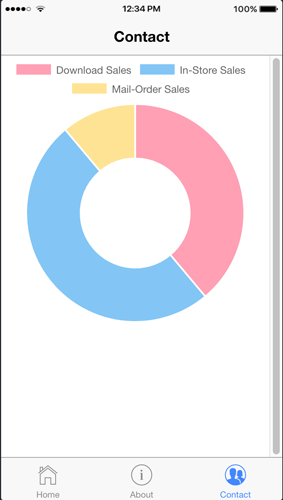
public doughnutChartLabels:string[] = ['Download Sales', 'In-Store Sales', 'Mail-Order Sales'];
public doughnutChartData:number[] = [350, 450, 100];
public doughnutChartType:string = 'doughnut';
// events
public chartClicked(e:any):void {
console.log(e);
}
public chartHovered(e:any):void {
console.log(e);
}Take a look again at the running app on the browser. On the contact, the tab will look like this.
That's the sample of using charts in Ionic 3 and Angular 4 mobile app. You can find the sample codes on the GitHub.
We know that building beautifully designed Ionic apps from scratch can be frustrating and very time-consuming. Check Ionic 4 - Full Starter App and save development and design time. Android, iOS, and PWA, 100+ Screens and Components, the most complete and advance Ionic Template.
That just the basic. If you need more deep learning about Ionic, Angular, and Typescript, you can take the following cheap course:
- IONIC 4 Design Hybrid Mobile Applications IOS & Android
- Wordpress Rest API and Ionic 4 (Angular) App With Auth
- Mobile App from Development to Deployment - IONIC 4
- Ionic 4 Crash Course with Heartstone API & Angular
- Ionic 4 Mega Course: Build 10 Real World Apps
Thanks.